 Shelf Home

Movies of Atlantic Canada
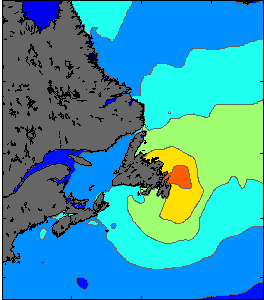
Data is used from WebTide, along with T-Tide, to predict the tidal elevations on a two-dimensional grid of the northwest Atlantic (see figure below). By adding the storm surge levels(DalCoast), we are able to predict the total sea level. The movies on the left show the two day forecast of the predicted tides, storm surge levels, and total sea levels for the northwest Atlantic region.
 Each frame in a movie represents an hour, with a total of 48 hours. The date and times are listed at the top of each animation in GMT. You can either let the movie loop or you can choose to manually view it using the controller at the bottom. The colorbar on the right indicates the height in metres.
You will need Macromedia Flash to view the movies listed on the left menu. To get the free plugin, click here