 Bay Home

Box Model Simulations of Plankton Dynamics on the Scotian Shelf
We have implemented a coarse resolution box model of Lunenburg Bay to test ecosystem models of varying complexity for simulation and prediction. The goal is to use these models to investigate potential determinants of spatial patterns in ecological characteristics by comparing simulated patterns (Figure 1) with those revealed by data from the observing system.
Ecosystems are inherently complex. By reducing their complexity we can model and study the determinants of observed patterns, as well as reduce the computing time required for simulation and prediction. The model we use divides Lunenburg Bay into a small number of boxes. Ecosystem models are used to simulate ecological characteristics within each box. These variables are then transported and mixed between the boxes according to the results of a high resolution circulation model. Figure 1 shows an example of a simulated spatial pattern. In this particular example, the model predicts an increase in phytoplankton biomass from the outside boundary towards the inner Bay (upper left). Lunenburg Bay being a shallow open system, the boundaries of the model are a major determinant of the bay dynamics. In this example (Figure 1), the supply of nutrients to the phytoplankton is mainly from detritus remineralization which is influenced by processes at the boundaries (sediment resuspension, exchanges with the shelf) as well as in the Bay itself (rate of remineralization in the bay). We hope that comparison of simulations with data under different circulation regimes will help us tease apart the roles of external and internal controls on ecological processes in the Bay.
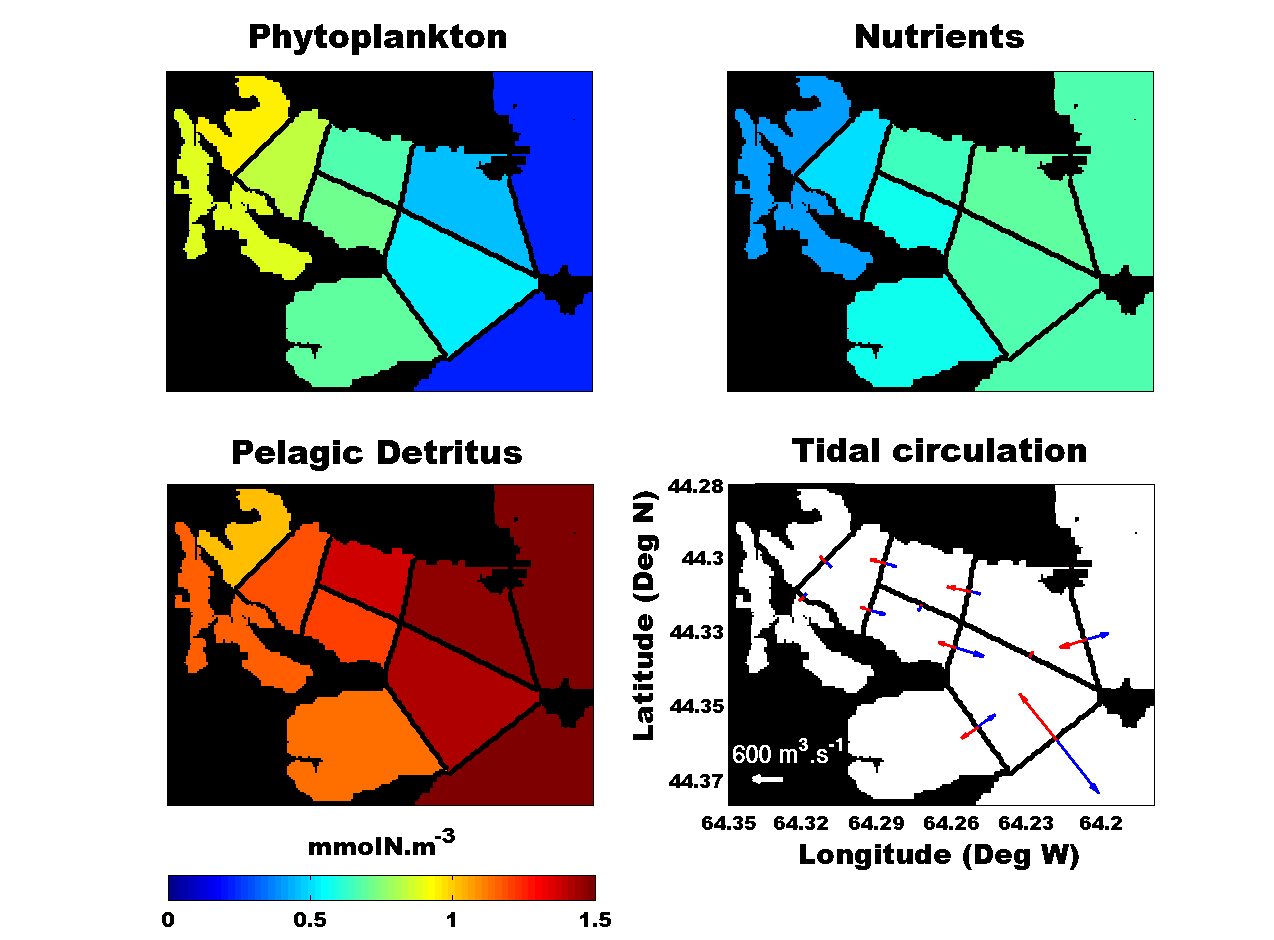
Figure 1. Spatial representation of simulated ecosystem components using a phytoplankton-nutrient-detritus (PND) model. The maps show an increase in phytoplankton inshore (upper left), which is the result of a higher nutrient availability from detritus remineralization. The lower right panel show the depth integrated transports between boxes at ebb tide (blue arrows) and flood tide (red arrows).
A. Laurent¹,A.F. Vézina¹,², J.J. Cullen¹
¹ Oceanography Department, Dalhousie University, Halifax, N.S
² Bedford Institute of Oceanography, Dartmouth, N.S.